Scoring my 2021 Predictions
Table of Contents
At the beginning of last year, I made predictions for the year. Now it’s time to score them (before I make my 2022 predictions).
Data & code #
Here is a spreadsheet containing my scored predictions. If you want to see my full analysis, you can look at my Jupyter notebook which contains Brier score calculations plus plotting.
High level analysis #
The key metrics I looked at were my overall and by category Brier scores plus calibration. My overall Brier score was .18. (1)As a refresher, the Brier score is the mean squared error of a set of predictions vs. the true outcomes. So, for example, if I predict something will happen with probability .2 and something else will happen with probability .4 and then both happen, my Brier score for this pair of events is $ ((1-.2)^2 + (1-.4)^2)/2 = .5$. This means that lower Brier scores are better, with the best possible Brier score being 0 and the worst 1. The Brier score is a strictly proper scoring rule, which means that it will always be maximized by the true probabilities (assuming they were known) for a set of events. Note that despite this, Brier scores are not ideal for very rare events. The intuition for why this can be true despite them being strictly proper scoring rules boils down to the strictly proper condition only requiring that the score decrease as the result of any one prediction diverging from the probability of the event rather than dictating by how much.
In addition to my overall Brier score, I’ve included by category Brier scores below.
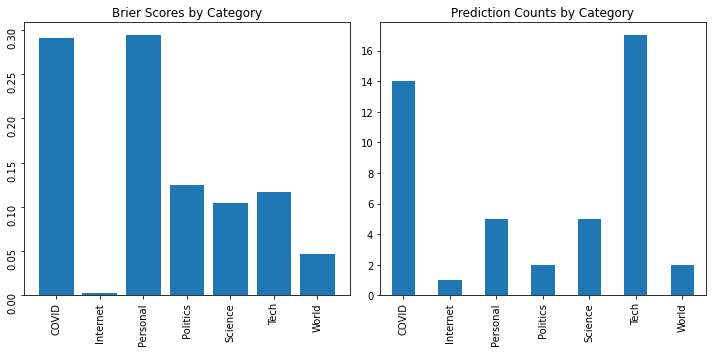
These by category Brier scores should be taking with a grain of salt because I made very few predictions for some categories. For example, although my Brier score for “Internet” looks great, in reality, I made one correct high confidence prediction about Scott Alexander starting a Substack.
I used three numbers as a benchmark for my Brier score. The first is my PredictionBook Brier score of .17. My takeaway from this is that my 2021 predictions were about as accurate as my historical predictions on PredictionBook overall. The other two numbers are Gwern’s PredictionBook Brier score of .16 and the example Superforecaster Brier score from this post of .14. Note that, as benchmarks, these are imperfect because they’re being evaluated against entirely different sets of predictions and therefore can’t tell us how much better (or worse) someone would have done on the same predictions.
The Brier score measures both calibration and accuracy whereas a calibration plot only focuses on the former. In layman’s terms, it tells me how well I “know what I do/don’t know”. My calibration plots also look pretty good this year!
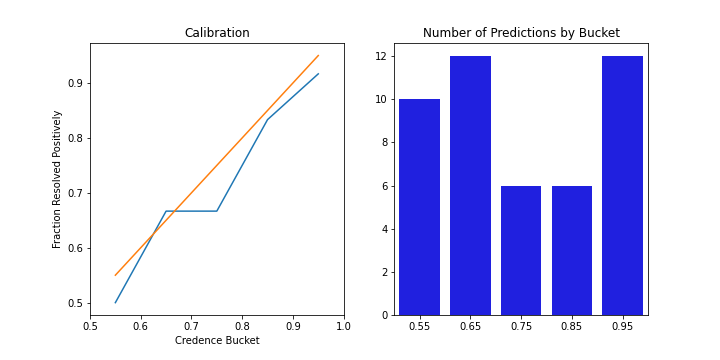
The left plot shows calibration relative to perfect calibration (orange line) and the right plot shows the number of predictions I made in each bucket. Perfect calibration would have all points on the orange line, which would mean that my resolved frequencies match my assigned probabilities perfectly. As a more realistic point of comparison, I recommend checking out Gwern’s PredictionBook calibration plot. His looks almost perfect except for a bit of under-confidence in the 100% bucket. You can also compare to mine on PredictionBook, which don’t look great. Mine for this year look quite a bit better than mine on PredictionBook but still worse than Gwern’s there. I’m happy about this because it suggests I’m becoming more calibrated over time. Failing to outperform Gwern doesn’t bother me too much because he’s Gwern and the plots here are based on fewer predictions. I definitely have a bit of room to improve in terms of being over-confident for highly uncertain predictions but overall I’m satisfied.
Finally, one of my (best) readers, Eric Neyman took me up on my offer to score others’ predictions and sent me predictions for a subset of the events I made predictions for. As a more head-to-head comparison, I computed Brier scores for Eric’s and my predictions on the subset of events we both predicted on. For these events, our Brier scores were basically identical, both equaling ~.2. This is a big ego boost for me because I view Eric as a very level-headed careful forecaster, so the fact that I was able to match his accuracy on this admittedly small set of events is exciting!
Reflections #
Lessons from this year’s predictions and results #
Overall, I’m disappointed by little actionable feedback I got from seeing the results for last year’s predictions. Having done the above analysis, I don’t feel particularly equipped to improve my predictions for 2022. That said, there are a few lessons from this year’s predictions I’m going to keep in mind going forward.
The planning fallacy is real #
While my “Personal” by category Brier score doesn’t look much worse than my COVID one, if you look at the actual predictions, you’ll see that I was less accurate on the (IMO) more important Personal things I predicted about. Concretely, I didn’t lose as much weight as I expected and am still polishing a paper I really thought I’d have on Arxiv by now. Beyond suggesting that maybe I should spend less time on blog posts, this suggests that I am subject to the planning fallacy just like everyone else. (On the bright side, it also means I don’t have to worry too much about self-fulfilling prophecy issues when making personal predictions I guess.) I’d like to try and improve on this in the future, but figuring out how and actually running experiments to see whether I can improve probably deserves more attention than I can give it in this post.
Tracking predictions helps combat revisionist optimism and pessimism #
My track record on COVID provided an empirical counterpoint to my general feeling of cynicism about how our institutions have handled COVID in the past year. I overestimated the number of cases we’d have in the US by March 31st and significantly underestimated how quickly we’d roll out the first 100 million vaccines. I still think there’s incredible dysfunction within our regulatory apparatus, but this is a good reminder that a year ago, I expected things to go even worse than they did.
Finding reliable data sources is hard #
I struggled more than I otherwise would have in scoring my predictions in part because several of the sources I’d used either no longer existed or seemed unreliable.
The primary example of this is the Good Judgement Project’s COVID dashboard disappearing and providing no link to see what the results were. The dashboard’s disappearance left me struggling to score some of my COVID vaccine distribution predictions according to the criteria I’d originally set out (see cells 31 through 34 here). In the end, I ended up using the CDC’s cumulative vaccinations dashboard to score these instead but had this not existed, I would’ve been in trouble.
A secondary example of this is that (thanks to Eric Neyman for pointing this out) my initial number for total number of people in the world living in extreme poverty (source) was significantly higher (750M) than what Eric saw when he looked a few days later (650M). I have to assume this involved a temporary glitch on their end since the current number, 705M, is much more aligned with my overall prior that global poverty is continuing to robustly decline plus the decline in poverty trends the realtime metrics on the site point towards. Had I instead only looked when Eric looked, I might have been misled and come to a very different conclusion about both my prediction and world poverty trends. Granted, I would’ve gone back and checked other sources, but this still highlights the importance of reliable, consistent data sources for accurately scoring predictions.
Focus on process over results #
Last year, I only recorded my predictions and not the justifications for them. This means that in cases where my predictions are especially wrong in hindsight, I often don’t remember why I predicted so confidently in the first place.
An especially egregious example of this is my 4% prediction that that there would be fewer than 40M estimated in the US by March 31st. According to the CDC, the number of cumulative cases in the US as of March 31st was 30M, quite a bit below 40M. Looking back, I’m not sure whether 1) I was just underestimating the speed of the vaccine rollout and overestimating for how long COVID’s spread would continue at its January 2021 rate or 2) the CDC went back and revised their estimates. As evidence for hypothesis 1, I did underestimate the speed of the vaccine rollout so it’s possible my confidence in this prediction almost entirely came from that. On the other hand, if I naively extrapolate from the January 17, 2021 trend line forward to March 31st, 2021 assuming fixed growth in cases, it seems roughly 50/50 whether the line would cross 40M by then. It’s possible at the time I assumed continued exponential rather than linear growth which led me to predict more confidently than linear extrapolation would suggest but I’m not sure.
This is all to say that I’d be able to learn much more from my mistakes had I wrote down my justifications for predictions rather than just recording credences. Thankfully, I’ve already started to this for bets and Kalshi and plan to do the same for 2022 predictions and future predictions I make on Metaculus.
![]()
I do expect that this means I’ll make fewer predictions overall, but this seems worth it if my goal is to actually improve.
Find faster feedback loops #
Another challenge with annual predictions is that the feedback loops are slow. I’m already mitigating this by making more predictions on the other platforms I’ve mentioned and tracking justifications in addition to credences, but I also plan to include more shorter time-horizon – 1 month or 1 quarter – predictions in my 2022 predictions than I did for 2021.
Lack of benchmarks and points of comparisons #
While I did compare to Gwern’s and a superforecasters Brier score as benchmarks, these are (as mentioned) unsatisfying because they’re not scored against the same predictions. My comparison to Eric was much more informative and I wish I had a similar option available for all my predictions.
Going forward, I may try two things to provide better points of comparison for my accuracy and calibration. The first is (again) making more predictions on Kalshi and Metaculus. In the case of the former, I get feedback in the form of how much money I make or lose. In the case of the latter, I can compare myself to both individual forecasters, the community predictions, and the algorithmic Metaculus prediction. The second is potentially experimenting with recording two predictions, one “naive” and one “all-things-considered”, for certain questions and then comparing the accuracy of the two strategies. As described elsewhere, simple algorithms often outperform human judgement so in cases where applicable, this will involve using as-simple-as-possible extrapolation algorithms and then comparing them to the results from me updating on inside view considerations or other alternative ways of assessing a question (potentially with ensembling). Doing this will have the added benefit of giving me more reps building simple models relatively quickly, which I suspect may also help me makie more money on Kalshi.
Conclusion #
Despite some frustration about struggling to interpret my results, I continue to benefit from making predictions and tracking the results. Among other things, doing so has provided me with a tacit understanding of much of what Tetlock, Gwern, and others have discussed:
- The gap between making general claims about trends and pinpointing expected quantitative outcomes. This is a big part of the reason why “a bet is a tax on bullshit.”
- The gap between general feelings of pessimism/optimism often driven by mood affiliation and actually having feelings track measurable outcomes.
- Reality’s surprising detail leading to imagined scenarios often entirely missing key factors in eventual outcomes.
Going forward, I’m interested in continuing to improve my basic prediction skills but also applying what I learned to more “personal” areas (ironically the area at which I currently perform worst). While I’m aware of the poor track record in applying these sorts of techniques to become more “effective”, I aesthetically like the idea of being more calibrated about how long things will take, which projects will succeed, and therefore am willing to experiment with it even if its probability of success is low.
Slightly in tension with the above is that I want to spend more time developing an “inside view” for a smaller set of topics this year, rather than focusing equally on areas in which I’ll never be an expert (“World”, “Politics”). For this reason, I spend to focus my 2022 predictions more on ML/AI, biotech, tech, and science.
Last, I’ve gained an (even) greater respect for Superforecasters’ (see also) ability to consistently make such accurate predictions through seeing how hard improving or even maintaining a good track record can be.
See you all in 2022!