Scaling #
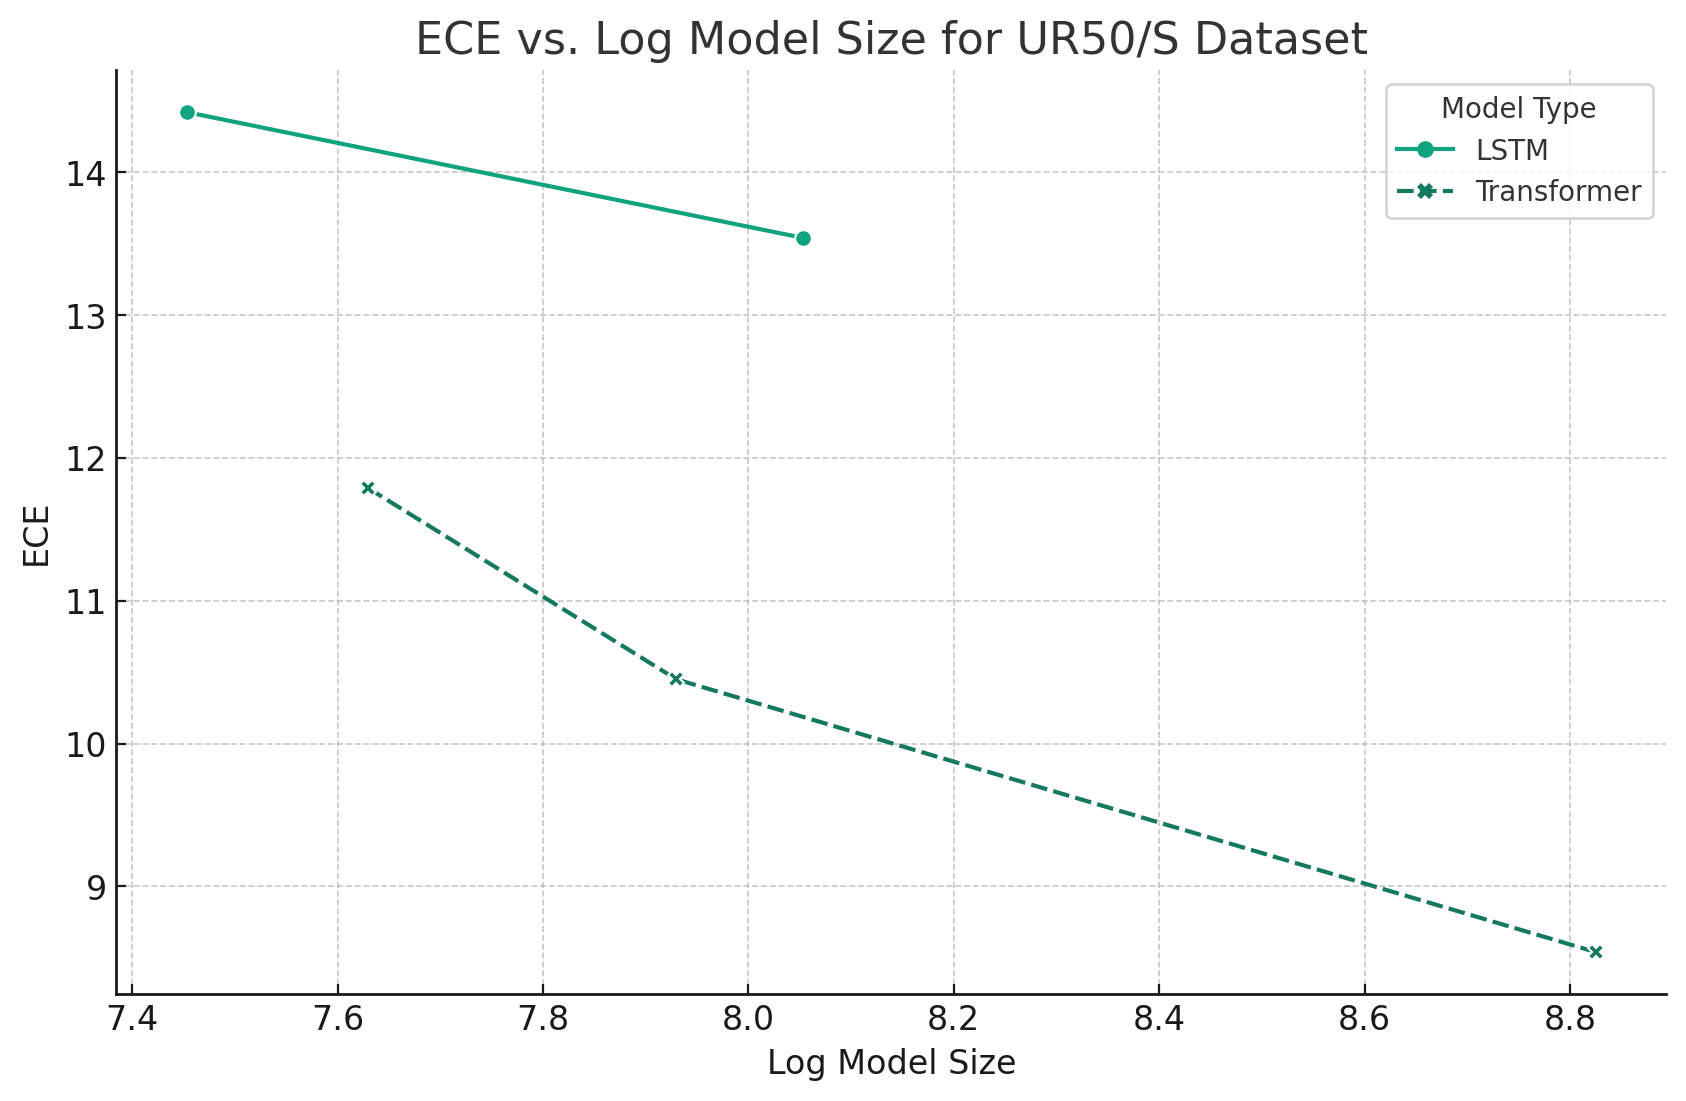
Some of the earliest evidence for PLM scaling behaving similar to LLM scaling came from ESM-1b. The following plot shows model performance as a function of (log10) number of parameters. As seen there, they also trained LSTM models at two different sizes as baselines.

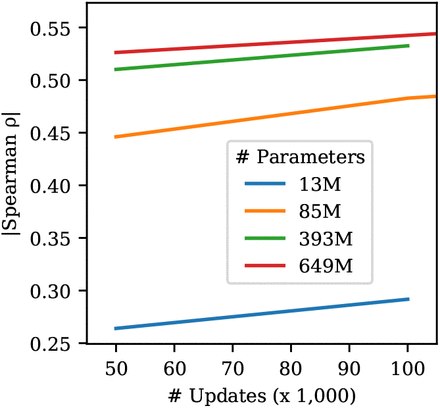
RITA provided even stronger evidence for PLMs following scaling laws. The RITA paper trained auto-regressive models of different sizes and used their performance to derive power laws for scaling performance. It used this power law to pick 4
As LLM papers often do, the ESM-1b paper used perplexity (exponent of the entropy) to evaluate the impact of model size on performance. Much of perplexity’s value in NLP comes from its strong correlation with performance on a wide range of practical tasks. We don’t have nearly as strong an understanding of the relationship between PLM perplexity and downstream task performance but preliminary evidence points to a relationship.

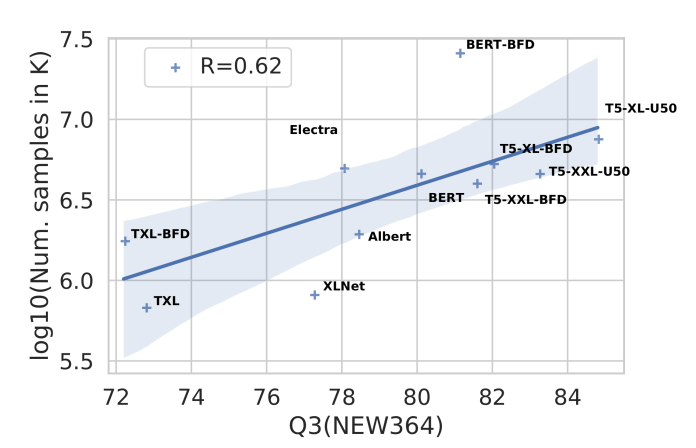
ProtTrans furnished additional evidence for a scaling relationship, in this case between the number of data points seen during training and performance on a different set of downstream tasks. Even if we ignore the data points for the three T5 models because of the size confounder, the trend of seeing more data points improving performance on the 3-state secondary structure classification task remains strong.
$ \log_{10}(\textrm{Number of samples}) $ vs. performance on NEW364 secondary structure prediction. Even confounded by different model architectures, we see a high correlation between number of samples seen during training and downstream task performance.

- ESMFold
- Progen2
- Mixed evidence:
- Use table 3 to make a zero-shot fitness prediction performance plot as a function of size
- Use table 4 to make a downstream task performance plot as a function of size
- Mixed evidence: